Friday, April 15, 2011

Installing and configuring Graphite

Here are some notes I jotted down while installing and configuring Graphite, which isn't a trivial task, although the official documentation isn't too bad. The next step is to turn them into a Chef recipe. These instructions apply to Ubuntu 10.04 32-bit with Python 2.6.5 so YMMV.

Install pre-requisites

# apt-get install python-setuptools
# apt-get install python-memcache python-sqlite
# apt-get install apache2 libapache2-mod-python pkg-config
# easy_install-2.6 django

Install pixman, cairo and pycairo

# wget http://cairographics.org/releases/pixman-0.20.2.tar.gz
# tar xvfz pixman-0.20.2.tar.gz
# cd pixman-0.20.2
# ./configure; make; make install

# wget http://cairographics.org/releases/cairo-1.10.2.tar.gz
# tar xvfz cairo-1.10.2.tar.gz
# cd cairo-1.10.2
# ./configure; make; make install

BTW, the pycairo install was the funkiest I've seen so far for a Python package, and that says a lot:

# wget http://cairographics.org/releases/py2cairo-1.8.10.tar.gz
# tar xvfz py2cairo-1.8.10.tar.gz
# cd pycairo-1.8.10
# ./configure --prefix=/usr
# make; make install
# echo ‘/usr/local/lib’ > /etc/ld.so.conf.d/pycairo.conf
# ldconfig

Install graphite packages (carbon, whisper, graphite webapp)

# wget http://launchpad.net/graphite/0.9/0.9.8/+download/graphite-web-0.9.8.tar.gz
# wget http://launchpad.net/graphite/0.9/0.9.8/+download/carbon-0.9.8.tar.gz
# wget http://launchpad.net/graphite/0.9/0.9.8/+download/whisper-0.9.8.tar.gz

# tar xvfz whisper-0.9.8.tar.gz
# cd whisper-0.9.8
# python setup.py install

# tar xvfz carbon-0.9.8.tar.gz
# cd carbon-0.9.8
# python setup.py install
# cd /opt/graphite/conf
# cp carbon.conf.example carbon.conf
# cp storage-schemas.conf.example storage-schemas.conf

# tar xvfz graphite-web-0.9.8.tar.gz
# cd graphite-web-0.9.8
# python check-dependencies.py
# python setup.py install

Configure Apache virtual host for graphite webapp

Although the Graphite source distribution comes with an example vhost configuration for Apache, it didn't quite work for me. Here's what ended up working -- many thanks to my colleague Marco Garcia for figuring this out.
# cd /etc/apache2/sites-available/
# cat graphite

<VirtualHost *:80>
ServerName graphite.mysite.com
DocumentRoot "/opt/graphite/webapp"
ErrorLog /opt/graphite/storage/log/webapp/error.log
CustomLog /opt/graphite/storage/log/webapp/access.log common
<Location "/">
SetHandler python-program
PythonPath "['/opt/graphite/webapp'] + sys.path"
PythonHandler django.core.handlers.modpython
SetEnv DJANGO_SETTINGS_MODULE graphite.settings
PythonDebug Off
PythonAutoReload Off
</Location>
<Location "/content/">
SetHandler None
</Location>
<Location "/media/">
SetHandler None
</Location>
Alias /media/ "/usr/local/lib/python2.6/dist-packages/Django-1.3-py2.6.egg/django/contrib/admin/media/"
</VirtualHost>

# cd /etc/apache2/sites-enabled/
# ln -s ../sites-available/graphite 001-graphite

Make sure mod_python is enabled:

# ls -la /etc/apache2/mods-enabled/python.load

Create Django database for graphite webapp

# cd /opt/graphite/webapp/graphite
# python manage.py syncdb

Apply permissions on storage directory

# chown -R www-data:www-data /opt/graphite/storage/

Restart Apache

# service apache2 restart

Start data collection server (carbon-cache)

# cd /opt/graphite/bin
# ./carbon-cache.py start

At this point, if you go to graphite.mysite.com, you should see the dashboard of the Graphite web app.

Test data collection

The Graphite source distribution comes with an example client written in Python that sends data to the Carbon collecting server every minute. You can find it in graphite-web-0.9.8/examples/example-client.py.

Sending data is very easy -- like we say in Devops, just open a socket!


import sys
import time
import os
import platform
import subprocess
from socket import socket

CARBON_SERVER = '127.0.0.1'
CARBON_PORT = 2003
delay = 60
if len(sys.argv) > 1:
delay = int( sys.argv[1] )

def get_loadavg():
# For more details, "man proc" and "man uptime"
if platform.system() == "Linux":
return open('/proc/loadavg').read().strip().split()[:3]
else:
command = "uptime"
process = subprocess.Popen(command, stdout=subprocess.PIPE, shell=True)
os.waitpid(process.pid, 0)
output = process.stdout.read().replace(',', ' ').strip().split()
length = len(output)
return output[length - 3:length]


sock = socket()
try:
sock.connect((CARBON_SERVER,CARBON_PORT))
except:
print "Couldn't connect to %(server)s on port %(port)d" % {'server':CARBON_SERVER, 'port':CARBON_PORT}
sys.exit(1)

while True:
now = int( time.time() )
lines = []
# We're gonna report all three loadavg values
loadavg = get_loadavg()
lines.append("system.loadavg_1min %s %d" % (loadavg[0],now))
lines.append("system.loadavg_5min %s %d" % (loadavg[1],now))
lines.append("system.loadavg_15min %s %d" % (loadavg[2],now))

message = '\n'.join(lines) + '\n'
#all lines must end in a newline
print "sending message\n"
print '-' * 80
print message
print
sock.sendall(message)
time.sleep(delay)


Some observations about the above code snippet:
  • the format of a message to be sent to a Graphite/Carbon server is very simple: "metric_path value timestamp\n"
  • metric_path is a completely arbitrary name -- it is a string containing substrings delimited by dots. Think of it as an SNMP OID, where the most general name is at the left and the most specific is at the right
    • in the example above, the 3 metric_path strings are system.loadavg_1min, system.loadavg_5min and system.loadavg_15min
Establish retention policies

This is explained very well in the 'Getting your data into Graphite' portion of the docs. What you want to do is to specify a retention configuration for each set of metrics that you send to Graphite. This is accomplished by editing the /opt/graphite/storage/schemas file. For the example above which send the load average for 1, 5 and 15 min to Graphite every minute, we can specify the following retention policy:

[loadavg]
priority = 100
pattern = ^system\.loadavg*
retentions = 60:43200,900:350400

This tells graphite that all metric_paths starting with system.loadavg should be stored with a retention policy that keeps per minute (60 seconds) precision data for 30 days(43,200 seconds), and per-15 min (900 sec) precision data for 10 years (350,400 seconds).

Go wild with stats!

At this point, if you run the example client, you should be able to go to the Graphite dashboard and expand the Graphite->system path and see the 3 metrics being captured: loadavg_1min, loadavg_5min and loadavg_15min. Clicking on each one will populate the graph with the corresponding data line. If you're logged in into the dashboard, you can also save a given graph.

The sky is the limit at this point in terms of the data you can capture and visualize with Graphite. As an example, I parse a common maillog file that captures all email sent out through our system. I 'tail' the file every minute and I count how many message were sent out total, and per mail server in our mail cluster. I send this data to Graphite and I watch it in near-realtime (the retention policy in my case is similar to the loadavg one above).

Here's how the Graphite graph looks like:


In another blog post I'll talk about Etsy's statsd and its Python equivalent pystatsd, to which my colleague Josh Frederick contributed the server-side code.


Monday, March 28, 2011

Working in the multi-cloud with libcloud

I just posted my slides on "Working on the multi-cloud with libcloud" to Slideshare. It's a talk I gave at the SoCal Piggies meeting in February 2011.

Friday, March 25, 2011

ABM - "Always Be Monitoring"

What prompted this post was an incident we had in the very early hours of this past Tuesday, when we started to see a lot of packet loss, increased latency and timeouts between some of our servers hosted at a data center on the US East Coast, and some instances we have running in EC2, also in the US East region. The symptoms were increased error rates in some application calls that we were making from one back-end server cluster at the data center into another back-end cluster in EC2. These errors weren't affecting our customers too much, because all failed requests were posted to various queues and reprocessed.

There had also been network maintenance done that night within the data center, so we weren't sure initially if it's our outbound connectivity into EC2 or general inbound connectivity into EC2 that was the culprit. What was strange (and unexpected) too was that several EC2 availability zones seemed to be affected -- mostly us-east-1d, but we were also seeing increased latency and timeouts into 1b and 1a. That made it hard to decide whether the issue was with EC2 or with us.

Running traceroutes from different source machines (some being our home machines in California, another one being a Rackspace cloud server instance in Chicago) revealed that packet loss and increased latency occurred almost all the time at the same hop: a router within the Level 3 network upstream from the Amazon EC2 network. What was frustrating too was that the AWS Status dashboard showed everything absolutely green. Now you can argue that this wasn't necessarily an EC2 issue, but if I were Amazon I would like to monitor the major inbound network paths into my infrastructure -- especially when it has the potential to affect several availability zones at once.

This whole issue lasted approximately 3.5 hours, then it miraculously stopped. Somebody must have fixed a defective router. Twitter reports from other people experiencing the exact same issue revealed that the issue was seen as fixed for them at the very minute that it was fixed for us too.

This incident brought home a valuable point for me though: we needed more monitors than we had available. We were monitoring connectivity 1) within the data center, 2) within EC2, and 3) between our data center and EC2. However, we also needed to monitor 4) inbound connectivity into EC2 going from sources that were outside of our data center infrastructure. Only by triangulating (for lack of a better term) our monitoring in this manner would we be sure which network path was to blame. Note that we already had Pingdom set up to monitor various URLs within our site, but like I said, the front-end stuff wasn't affected too much by that particular issue that night.

So...the next day we started up a small Rackspace cloud server in Chicago, and a small Linode VPS in Fremont, California, and we added them to our Nagios installation. We run the same exact checks from these servers into EC2 that we run from our data center into EC2. This makes network issues faster to troubleshoot, although unfortunately not easier to solve -- because we could be depending on a 3rd party to solve them.

I guess a bigger point to make, other than ABM/Always Be Monitoring, is OYA/Own Your Availability (I didn't come up with this, I personally first saw it mentioned by the @fastip guys). To me, what this means is to deploy your infrastructure across multiple providers (data centers/clouds) so that you don't have a single point of failure at the provider level. This is obviously easier said than done....but we're working on it as far as our infrastructure goes.

Wednesday, March 16, 2011

What I like and don't like to see in a technical presentation

What I like to see:

  • Live demo of the technology/tool/process you are describing (or at least a screencast)
  • Lessons learned -- the most interesting ones are the failures
  • If you're presenting something you created:
    • compare and contrast it with existing solutions 
    • convince me you're not suffering from the NIH syndrome
    • convince me your creation was born out of necessity, ideally from issues you needed to solve in production
  • Hard data (charts/dashboards)
  • Balance between being too shallow and going too deep when covering your topic
    • keep in mind both the HOW and the WHY of the topic
  • Going above and beyond the information I can obtain with a simple Google search for that topic
  • Pointers to any tools/resources you reference (GitHub pages preferred)

What I don't like to see:

  • Cute slides with images and only a couple of words (unless you provide generous slide notes in some form)
  • Humor is fine, but not if it's all there is
  • Hand-waving / chest-pounding
  • Vaporware
  • No knowledge of existing solutions with established communities
    • you're telling me you're smarter than everybody else in the room but you're not backing up that assertion
  • Simple usage examples that I can also get via Google searches
  • Abandoning the WHY for the HOW
  • Abandoning the HOW for the WHY

Monday, March 14, 2011

Deployment and hosting open space at PyCon

One of the most interesting events for me this year at PyCon was an Open Space session organized by Nate Aune on deployment, hosting and configuration management. The session was very well attended, and it included representatives of a large range of companies. Here are some of them, if memory serves well: Disqus, NASA, Opscode, DjangoZoom, Eucalyptus, ep.io, Gondor, Whiskey Media ... and many more that I wish I could remember (if you were there and want to add anything, please leave a comment here).

Here are some things my tired brain remembers from the discussions we had:

  • everybody seems to be using virtualenv when deploying their Python applications
  • everybody seems to be using Fabric in one way or another to push changes to remote nodes
  • the participants seemed to be split almost equally between Puppet and Chef for provisioning
  • the more disciplined of the companies (ep.io for example) use Puppet/Chef both for provisioning and application deployment and configuration (ep.io still uses Fabric for stopping/starting services on remote nodes for example)
  • other companies (including us at Evite) use Chef/Puppet for automated provisioning of the OS + pre-requisite packages, then use Fabric to push the deployment of the application because they prefer the synchronous aspect of a push approach
  • upgrading database schemas is hard; many people only do additive changes (NoSQL makes this easier, and as far as relational databases go, PostgreSQL makes it easier than MySQL )
  • many people struggle with how best to bundle their application with other types of files, such as haproxy or nginx configurations
    • at Evite we face the same issue, and we came up with the notion of a bundle, a directory structure that contains the virtualenv of the application, the configuration files for the application, and all the other configuration files for programs that interact with our application -- haproxy, nginx, supervisord for example
    • when we do a deploy, we check out a bundle via a revision tag, then we push the bundle to a given app server
  • some people prefer to take the OS package approach here, and bundle all the above types of files in an rpm or deb package
  • Noah Kantrowitz has released 2 Chef-related Python tools that I was not aware of: PyChef (a Python client that knows how to query a Chef server) and commis (a Python implementation of a Chef server, with the goal of being less complicated to install than its Ruby counterpart)
  • LittleChef was mentioned as a way to run Chef Solo on a remote node via fabric, thus giving you the control of a 'push' method combined with the advantage of using community cookbooks already published for Chef
  • I had to leave towards the end of the meeting, when people started to discuss the hosting aspect, so I don't have a lot to add here -- but it is interesting to me to see quite a few companies that have Platform-as-a-Service (PaaS) offerings for Python hosting: DjangoZoom, ep.io, Gondor (ep.io can host any WSGI application, while the DjangoZoom and Gondor are focused on Django)

All in all, there were some very interesting discussions that showed that pretty much everybody is struggling with similar issues. There is no silver bullet, but there are some tools and approaches that can help make your life easier in this area. My impression is that the field of automated deployments and configuration management, even though changing fast, is also maturing fast, with a handful of tools dominating the space. It's an exciting space to play in!

Tuesday, March 08, 2011

Monitoring is for ops what testing is for dev

Devops. It's the new buzzword. Go to any tech conference these days and you're sure to find an expert panel on the 'what' and 'why' of devops. These panels tend to be light on the 'how', because that's where the rubber meets the road. I tried to give a step-by-step description of how you can become a Ninja Rockstar Internet Samurai devops in my blog post on 'How to whip your infrastructure into shape'.

Here I just want to say that I am struck by the parallels that exist between the activities of developer testing and operations monitoring. It's not a new idea by any means, but it's been growing on me recently.

Test-infected vs. monitoring-infected

Good developers are test-infected. It doesn't matter too much whether they write tests before or after writing their code -- what matters is that they do write those tests as soon as possible, and that they don't consider their code 'done' until it has a comprehensive suite of tests. And of course test-infected developers are addicted to watching those dots in the output of their favorite test runner.

Good ops engineers are monitoring-infected. They don't consider their infrastructure build-out 'done' until it has a comprehensive suite of monitoring checks, notifications and alerting rules, and also one or more dashboard-type systems that help them visualize the status of the resources in the infrastructure.

Adding tests vs. adding monitoring checks

Whenever a bug is found, a good developer will add a unit test for it. It serves as a proof that the bug is now fixed, and also as a regression test for that bug.

Whenever something unexpectedly breaks within the systems infrastructure, a good ops engineer will add a monitoring check for it, and if possible a graph showing metrics related to the resource that broke. This ensures that alerts will go out in a timely manner next time things break, and that correlations can be made by looking at the metrics graphs for the various resources involved.

Ignoring broken tests vs. ignoring monitoring alerts

When a test starts failing, you can either fix it so that the bar goes green, or you can ignore it. Similarly, if a monitoring alert goes off, you can either fix the underlying issue, or you can ignore it by telling yourself it's not really critical.

The problem with ignoring broken tests and monitoring alerts is that this attitude leads slowly but surely to the Broken Window Syndrome. You train yourself to ignore issues that sooner or later will become critical (it's a matter of when, not if).

A good developer will make sure there are no broken tests in their Continuous Integration system, and a good ops engineer will make sure all alerts are accounted for and the underlying issues fixed.

Improving test coverage vs. improving monitoring coverage

Although 100% test coverage is not sufficient for your code to be bug-free, still, having something around 80-90% code coverage is a good measure that you as a developer are disciplined in writing those tests. This makes you sleep better at night and gives you pride in producing quality code.

For ops engineers, sleeping better at night is definitely directly proportional to the quantity and quality of the monitors that are in place for their infrastructure. The more monitors, the better the chances that issues are caught early and fixed before they escalate into the dreaded 2 AM pager alert.

Measure and graph everything

The more dashboards you have as a devops, the better insight you have into how your infrastructure behaves, from both a code and an operational point of view. I am inspired in this area by the work that's done at Etsy, where they are graphing every interesting metric they can think of (see their 'Measure Anything, Measure Everything' blog post).

As a developer, you want to see your code coverage graphs showing decent values, close to that mythical 100%. As an ops engineer, you want to see uptime graphs that are close to the mythical 5 9's.

But maybe even more importantly, you want insight into metrics that tie directly into your business. At Evite, processing messages and sending email reliably is our bread and butter, so we track those processes closely and we have dashboards for metrics related to them. Spikes, either up or down, are investigated quickly.

Here are some examples of the dashboards we have. For now these use homegrown data collection tools and the Google Visualization API, but we're looking into using Graphite soon.

Outgoing email messages in the last hour (spiking at close to 100 messages/second):


Size of various queues we use to process messages (using a homegrown queuing mechanism):

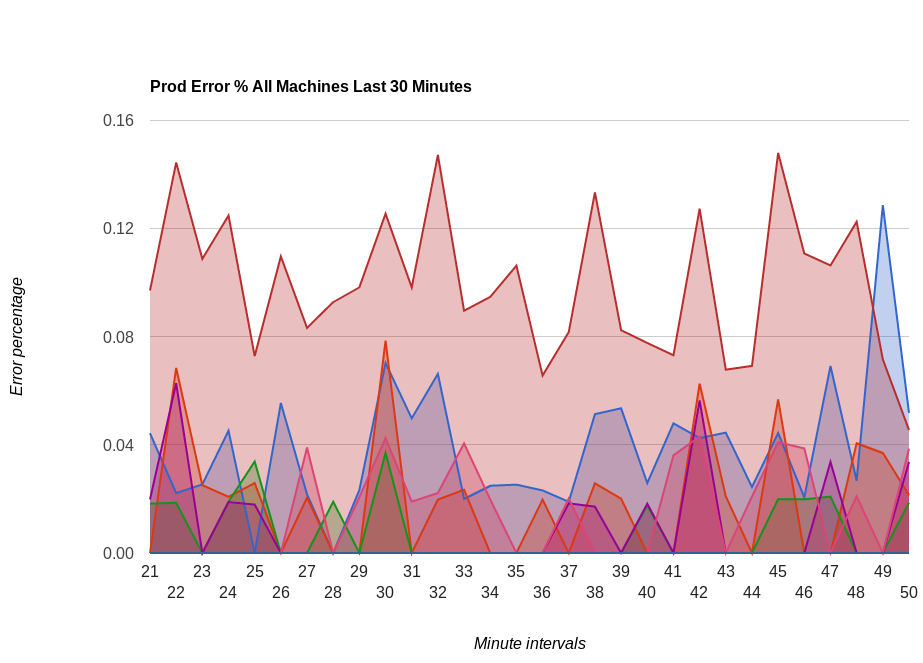
Percentage of errors across some of our servers:


Associated with these metrics we have Nagios alerts that fire when certain thresholds are being met. This combination allows our devops team to sleep better at night.

Saturday, February 26, 2011

AWS CloudFormation is a provisioning and not a config mgmt tool

There's a lot of buzz on Twitter on how the recently announced AWS CloudFormation service spells the death of configuration management tools such as Puppet/Chef/cfengine/bcfg2. I happen to think that the opposite is true.

CloudFormation is a great way to provision what it calls a 'stack' in your EC2 infrastructure. A stack comprises several AWS resources such as EC2 instances, EBS volumes, Elastic Load Balancers, Elastic IPs, RDS databases, etc. Note that it was always possible to do this via your own homegrown tools by calling in concert the various APIs offered by these services/resources. What CloudFormation brings to the table is an easy way to describe the relationships between these resources via a JSON file which they call a template.

Some people get tripped by the inclusion in the CloudFormation sample templates of applications such as WordPress, Joomla or Redmine -- they think that CloudFormation deals with application deployments and configuration management. If you look closely at one of these sample templates, let's say the Joomla one, you'll see that what happens is simply that a pre-baked AMI containing the Joomla installation is used when launching the EC2 instances included in the CloudFormation stack. Also, the UserData mechanism is used to pass certain values to the instance. They do add a nice feature here where you can reference attributes defined in other parts of the stack template, such as DB endpoint address in this example:

"UserData": {
          "Fn::Base64": {
            "Fn::Join": [
              ":",
              [
                {
                  "Ref": "JoomlaDBName"
                },
                {
                  "Ref": "JoomlaDBUser"
                },
                {
                  "Ref": "JoomlaDBPwd"
                },
                {
                  "Ref": "JoomlaDBPort"
                },
                {
                  "Fn::GetAtt": [
                    "JoomlaDB",
                    "Endpoint.Address"
                  ]
                },
                {
                  "Ref": "WebServerPort"
                },
                {
                  "Fn::GetAtt": [
                    "ElasticLoadBalancer",
                    "DNSName"
                  ]
                }
              ]
            ]
          }
        },

However, all this was also possible before CloudFormation. You were always able to bake your own AMI containing your own application, and use the UserData mechanism to run whatever you want at instance creation time. Nothing new here. This is NOT configuration management. This will NOT replace the need for a solid deployment and configuration management tool. Why? Because rolling your own AMI results in an opaque 'black box' deployment. You need to document and version your per-baked AMIs carefully, then develop a mechanism for associating an AMI ID with a list of packages installed on that AMI. If you think about it, you actually end up writing an asset management tool. Then if you need to deploy a new version of the application, you either bake a new AMI (painful), or you reach for a real deployment/config mgmt tool to do it.

The alternative, which I espouse, is to start with a bare-bone AMI (I use the official Ubuntu AMIs provided by Canonical) and employ the UserData mechanism to bootstrap the installation of a configuration management client such as chef-client or the Puppet client. The newly created instance then 'phones home' to your central configuration management server (Chef server or Puppetmaster for example) and finds out how to configure itself. The beauty of this approach is that the config mgmt server keeps track of the customizations made on the client. No need for you to document that separately -- just use the search functions provided by the config mgmt tool to find out which packages and applications have been installed on the client.

The barebone AMI + config mgmt mechanism does result in EC2 instances taking longer to get fully configured initially (as opposed to the pre-baked AMI technique), but the flexibility and control you gain over those instances is well worth it.

One other argument, that I almost don't need to make, is that the pre-baked AMI technique is very specific to EC2. You will have to reinvent the wheel if you want to deploy your infrastructure to a different cloud provider, or inside your private cloud or datacenter.

So.....do continue to hone your skills at learning how to fully utilize a good configuration management tool. It will serve you well, both in EC2 and in other environments.

Tuesday, February 22, 2011

Cheesecake project now on GitHub

I received a feature request for the Cheesecake project last week (thanks Joost Cassee!), so as an experiment I also put the code up on Github. Hopefully the 'social coding' aspect will kick in and more people will be interested in the project. One can dream.

HAProxy monitoring with Nagios and Munin

HAProxy is one of the most widely used (if not THE most widely used) software load balancing solution out there. I definitely recommend it if you're looking for a very solid and very fast piece of software for your load balancing needs. I blogged about it before, but here I want to describe ways to monitor it with Nagios (for alerting purposes) and Munin (for resource graphing purposes).

HAProxy Nagios plugin

Near the top of Google searches for 'haproxy nagios plugin' is this message to the haproxy mailing list from Jean-Christophe Toussaint which contains links to a Nagios plugin he wrote for checking HAProxy. This plugin is what I ended up using. It's a Perl script which needs the Nagios::Plugin CPAN module installed. Once you do it, drop check_haproxy.pl in your Nagios libexec directory, then configure it to check the HAProxy stats with a command line similar to this:

/usr/local/nagios/libexec/check_haproxy.pl -u 'http://your.haproxy.server.ip:8000/haproxy;csv' -U hauser -P hapasswd

This assumes that you have HAProxy configured to output its statistics on port 8000. I have these lines in /etc/haproxy/haproxy.cfg:
# status page.
listen stats 0.0.0.0:8000
    mode http
    stats enable
    stats uri /haproxy
    stats realm HAProxy
    stats auth hauser:hapasswd

Note that the Nagios plugin actually requests the stats in CSV format. The output of the plugin is something like:

HAPROXY OK -  cluster1 (Active: 60/60) cluster2 (Active: 169/169) | t=0.131051s;2;10;0; sess_cluster1=0sessions;;;0;20000 sess_cluster2=78sessions;;;0;20000

It shows the active clusters in your HAProxy configuration (e.g. cluster2), together with the number of backends that are UP among the total number of backends for that cluster (e.g 169/169), and also with the number of active sessions for each cluster. If any backend is DOWN, the check status code is critical and you'll get a Nagios alert.

HAProxy Munin plugins

Another Google search, this time for HAProxy and Munin, reveals another message to the haproxy mailing list with links to 4 Munin plugins written by Bart van der Schans:

- haproxy_check_duration: monitor the duration of the health checks per server
- haproxy_errors: monitor the rate of 5xx response headers per backend
- haproxy_sessions: monitors the rate of (tcp) sessions per backend
- haproxy_volume: monitors the bps in and out per backend

I downloaded the plugins, dropped them into /usr/share/munin/plugins, symlink-ed them into /etc/munin/plugins, and added this stanza to /etc/munin/plugin-conf.d/munin-node:

[haproxy*]
user haproxy
env.socket /var/lib/haproxy/stats.socket

However, note that for the plugins to work properly you need 2 things:

1) Configure HAProxy to use a socket that can be queried for stats. I did this by adding these lines to the global section in my haproxy.cfg file:

chroot /var/lib/haproxy
user haproxy
group haproxy
stats socket /var/lib/haproxy/stats.socket uid 1002 gid 1002

(where in my case 1002 is the uid of the haproxy user, and 1002 the gid of the haproxy group)

After doing 'service haproxy reload', you can check that the socket stats work as expected by doing something like this (assuming you have socat installed):

echo 'show stat' | socat unix-connect:/var/lib/haproxy/stats.socket stdio

This should output the HAProxy stats in CSV format.

2) Edit the 4 plugins and change the 'exit 1' statement to 'exit 1' at the top of each plugin:

if ( $ARGV[0] eq "autoconf" ) {
    print_autoconf();
    exit 0;
} elsif ( $ARGV[0] eq "config" ) {
    print_config();
    exit 0;
} elsif ( $ARGV[0] eq "dump" ) {
    dump_stats();
    exit 0;
} else {
    print_values();
    exit 0;
}

If you don't do this, the plugins will exit with code 1 even in the case of success, and this will be interpreted by munin-node as an error. Consequently, you will scratch your head wondering why no haproxy-related links and graphs are showing up on your munin stats page.

Once you do all this, do 'service munin-node reload' on the node running the HAProxy Munin plugins, then check that the plugins are working as expected by cd-ing into the /etc/munin/plugins directory and running each plugin through the 'munin-run' utility. For example:

# munin-run haproxy_sessions 
cluster2.value 146761052
cluster1.value 0

That's it. These plugins make it fairly easy for you to get more peace of mind and a better sleep at night. Although it's well known that in #devops we don't sleep that much anyway...

Tuesday, January 25, 2011

Using AWS Elastic Load Balancing with a password-protected site

Scenario: you have a password-protected site running in EC2 that you want handled via Amazon Elastic Load Balancing. The problem with that is that the HTTP healthchecks from the ELB to the instance hosting your site will fail because they will get a 401 HTTP status code instead of 200. Hence the instance will be marked as 'out of service' by the ELB.

My solution was to serve one static file (I called it 'check.html' containing the text 'it works!') without password protection.

In my case, I have nginx handling both the dynamic app (which is a Django app running on port 8000) and the static files. Here are the relevant excerpts from nginx.conf (check.html is in /usr/local/nginx/static-content):

http {
    include       mime.types;
    default_type  application/octet-stream;

    upstream django {
        server 127.0.0.1:8000;
    }

    server {
        listen       80;

        location / {
            proxy_pass http://django/;
            auth_basic            "Restricted";
            auth_basic_user_file  /usr/local/nginx/conf/.htpasswd;
        }

        location ~* ^.+check\.html$
        {
            root   /usr/local/nginx/static-content;
        }
    }
}

Wednesday, January 19, 2011

Passing user data to EC2 Ubuntu instances with libcloud

While I'm on the topic of libcloud, I've been trying to pass user data to newly created EC2 instances running Ubuntu. The libcloud EC2 driver has an extra parameter called ex_userdata for the create_node method, and that's what I've been trying to use.

However, the gotcha here is that the value of that argument needs to be the contents of the user data file, and not the path to the file.

So...here's what worked for me:

1) Created a test user data file with following contents:
#!/bin/bash

apt-get update
apt-get install -y munin-node python2.6-dev
hostname coolstuff

2) Used the following script to create the node (I also created a keypair which I passed to create_node as the ex_keypair argument):
#!/usr/bin/env python

import os, sys
from libcloud.types import Provider 
from libcloud.providers import get_driver 
from libcloud.base import NodeImage, NodeSize, NodeLocation
 
EC2_ACCESS_ID     = 'MyAccessID'
EC2_SECRET_KEY    = 'MySecretKey'
 
EC2Driver = get_driver(Provider.EC2) 
conn = EC2Driver(EC2_ACCESS_ID, EC2_SECRET_KEY)

keyname = sys.argv[1]
resp = conn.ex_create_keypair(name=keyname)
key_material = resp.get('keyMaterial')
if not key_material:
    sys.exit(1)
private_key = '/root/.ssh/%s.pem' % keyname
f = open(private_key, 'w')
f.write(key_material + '\n')
f.close()
os.chmod(private_key, 0600)

ami = "ami-88f504e1" # Ubuntu 10.04 32-bit
i = NodeImage(id=ami, name="", driver="")
s = NodeSize(id="m1.small", name="", ram=None, disk=None, bandwidth=None, price=None, driver="")
locations = conn.list_locations()
for location in locations:
    if location.availability_zone.name == 'us-east-1b':
        break

userdata_file = "/root/proj/test_libcloud/userdata.sh"
userdata_contents = "\n".join(open(userdata_file).readlines())

node = conn.create_node(name='tst', image=i, size=s, location=location, ex_keyname=keyname, ex_userdata=userdata_contents)
print node.__dict__

3) Waited for the newly created node to get to the Running state, then ssh-ed into the node using the key I created and verified that munin-node and python2.6-dev were installed, and also that the hostname was changed to 'coolstuf'.
# ssh -i ~/.ssh/lc1.pem ubuntu@domU-12-31-38-00-2C-3B.compute-1.internal

ubuntu@coolstuff:~$ dpkg -l | grep munin
ii  munin-common                      1.4.4-1ubuntu1                    network-wide graphing framework (common)
ii  munin-node                        1.4.4-1ubuntu1                    network-wide graphing framework (node)

ubuntu@coolstuff:~$ dpkg -l | grep python2.6-dev
ii  python2.6-dev                     2.6.5-1ubuntu6                    Header files and a static library for Python

ubuntu@coolstuff:~$ hostname
coolstuff

Anyway....hope this will be useful to somebody one day, even if that somebody is myself ;-)

libcloud 0.4.2 and SSL

Libcloud 0.4.2 was released yesterday. Among its new features is an important one: SSL certificate validation is now supported when opening a connection to a cloud provider. However, for this to work, you have to jump through a couple of hoops.

1) Python 2.5 doesn't have the ssl module installed (2.6 does) -- so you need to install it from PyPI. The current version for ssl is 1.15.

2) By default, SSL cert validation is disabled in libcloud.

If you open a connection to a provider you get:

/usr/lib/python2.5/site-packages/libcloud/httplib_ssl.py:55:
UserWarning: SSL certificate verification is disabled, this can pose a
security risk. For more information how to enable the SSL certificate
verification, please visit the libcloud documentation.
 warnings.warn(libcloud.security.VERIFY_SSL_DISABLED_MSG)


To get past the warning, you need to enable SSL cert validation and also provide a path to a file containing common CA certificates (if you don't have that file, you can download cacert.pem from http://curl.haxx.se/docs/caextract.html for example). Add these lines before opening a connection:
import libcloud.security
libcloud.security.VERIFY_SSL_CERT = True
libcloud.security.CA_CERTS_PATH.append("/path/to/cacert.pem")
As an aside, the libcloud wiki page on SSL is very helpful and I used it to figure out what to do.

Tuesday, December 21, 2010

Using libcloud to manage instances across multiple cloud providers

More and more organizations are moving to ‘the cloud’ these days. In most cases, using ‘the cloud’ means buying compute and storage capacity from a public cloud vendor such as Amazon, Rackspace, GoGrid, Linode, etc. I believe that the next step in cloud usage will be deploying instances across multiple cloud providers, mainly for high availability, but also for performance reasons (for example if a specific provider has a presence in a geographical region closer to your user base).

All cloud vendors offer APIs for accessing their services -- if they don’t, they’re not a genuine cloud vendor in my book at least. The onus is on you as a system administrator to learn how to use these APIs, which can vary wildly from one provider to another. Enter libcloud, a Python-based package that offers a unified interface to various cloud provider APIs. The list of supported vendors is impressive, and more are added all the time. Libcloud was started by Cloudkick but has since migrated to the Apache Foundation as an Incubator Project.

One thing to note is that libcloud goes for breadth at the expense of depth, in that it only supports a subset of the available provider APIs -- things such as creating, rebooting, destroying an instance, and listing all instances. If you need to go in-depth with a given provider’s API, you need to use other libraries that cover all or at least a large portion of the functionality exposed by the API. Examples of such libraries are boto for Amazon EC2 and python-cloudservers for Rackspace.

Introducing libcloud

The current stable version on libcloud is 0.4.0. You can install it from PyPI via

# easy_install apache-libcloud

The main concepts of libcloud are providers, drivers, images, sizes and locations.

A provider is a cloud vendor such as Amazon EC2 and Rackspace. Note that currently each EC2 region (US East, US West, EU West, Asia-Pacific Southeast) is exposed as a different provider, although they may be unified in the future.

The common operations supported by libcloud are exposed for each provider through a driver. If you want to add another provider, you need to create a new driver and implement the interface common to all providers (in the Python code, this is done by subclassing a base NodeDriver class and overriding/adding methods appropriately, according to the specific needs of the provider).

Images are provider-dependent, and generally represent the OS flavors available for deployment for a given provider. In EC2-speak, they are equivalent to an AMI.

Sizes are provider-dependent, and represent the amount of compute, storage and network capacity that a given instance will use when deployed. The more capacity, the more you pay and the happier the provider.

Locations correspond to geographical data center locations available for a given provider; however, they are not very well represented in libcloud. For example, in the case of Amazon EC2, they currently map to EC2 regions rather than EC2 availability zones. However, this will change in the near future (as I will describe below, proper EC2 availability zone management is being implemented). As another example, Rackspace is represented in libcloud as a single location, listed currently as DFW1; however, your instances will get deployed at a data center determined at your Rackspace account creation time (thanks to Paul Querna for clarifying this aspect).

Managing instances with libcloud

Getting a connection to a provider via a driver

All the interactions with a given cloud provider happen in libcloud across a connection obtained via the driver for that provider. Here is the canonical code snippet for that, taking EC2 as an example:


from libcloud.types import Provider
from libcloud.providers import get_driver
EC2_ACCESS_ID = 'MY ACCESS ID'
EC2_SECRET_KEY = 'MY SECRET KEY'
EC2Driver = get_driver(Provider.EC2)
conn = EC2Driver(EC2_ACCESS_ID, EC2_SECRET_KEY)


For Rackspace, the code looks like this:


USER = 'MyUser'
API_KEY = 'MyApiKey'
Driver = get_driver(Provider.RACKSPACE)
conn = Driver(USER, API_KEY)


Getting a list of images available for a provider

Once you get a connection, you can call a variety of informational methods on that connection, for example list_images, which returns a list of NodeImage objects. Be prepared for this call to take a while, especially in Amazon EC2, which in the US East region returns no less than 6,932 images currently. Here is a code snippet that prints the number of available images, and the first 5 images returned in the list:


EC2Driver = get_driver(Provider.EC2)
conn = EC2Driver(EC2_ACCESS_ID, EC2_SECRET_KEY)
images = conn.list_images()
print len(images)
print images[:5]
6982
[<NodeImage: id=aki-00806369, name=karmic-kernel-zul/ubuntu-kernel-2.6.31-300-ec2-i386-20091001-test-04.manifest.xml, driver=Amazon EC2 (us-east-1) ...>, <NodeImage: id=aki-00896a69, name=karmic-kernel-zul/ubuntu-kernel-2.6.31-300-ec2-i386-20091002-test-04.manifest.xml, driver=Amazon EC2 (us-east-1) ...>, <NodeImage: id=aki-008b6869, name=redhat-cloud/RHEL-5-Server/5.4/x86_64/kernels/kernel-2.6.18-164.x86_64.manifest.xml, driver=Amazon EC2 (us-east-1) ...>, <NodeImage: id=aki-00f41769, name=karmic-kernel-zul/ubuntu-kernel-2.6.31-301-ec2-i386-20091012-test-06.manifest.xml, driver=Amazon EC2 (us-east-1) ...>, <NodeImage: id=aki-010be668, name=ubuntu-kernels-milestone-us/ubuntu-lucid-i386-linux-image-2.6.32-301-ec2-v-2.6.32-301.4-kernel.img.manifest.xml, driver=Amazon EC2 (us-east-1) ...>]


Here is the output of same code running against the Rackspace driver:


23
[<NodeImage: id=58, name=Windows Server 2008 R2 x64 - MSSQL2K8R2, driver=Rackspace ...>, <NodeImage: id=71, name=Fedora 14, driver=Rackspace ...>, <NodeImage: id=29, name=Windows Server 2003 R2 SP2 x86, driver=Rackspace ...>, <NodeImage: id=40, name=Oracle EL Server Release 5 Update 4, driver=Rackspace ...>, <NodeImage: id=23, name=Windows Server 2003 R2 SP2 x64, driver=Rackspace ...>]


Note that a NodeImage object for a given provider may have provider-specific information stored in most cases in a variable called ‘extra’. It pays to inspect the NodeImage objects by printing their __dict__ member variable. Here is an example for EC2:


print images[0].__dict__
{'extra': {}, 'driver': <libcloud.drivers.ec2.ec2nodedriver 0xb7eebfec="" at="" object="">, 'id': 'aki-00806369', 'name': 'karmic-kernel-zul/ubuntu-kernel-2.6.31-300-ec2-i386-20091001-test-04.manifest.xml'}


In this case, the NodeImage object has an id, a name and a driver, with no ‘extra’ information.

Same code running against Rackspace, with similar information being returned:


print images[0].__dict__
{'extra': {'serverId': None}, 'driver': <libcloud.drivers.rackspace.rackspacenodedriver 0x88b506c="" at="" object="">, 'id': '4', 'name': 'Debian 5.0 (lenny)'}


Getting a list of sizes available for a provider

When you call list_sizes on a connection to a provider, you retrieve a list of NodeSize objects representing the available sizes for that provider.

Amazon EC2 example:


EC2Driver = get_driver(Provider.EC2)
conn = EC2Driver(EC2_ACCESS_ID, EC2_SECRET_KEY)
sizes = conn.list_sizes()
print len(sizes)
print sizes[:5]
print sizes[0].__dict__
9
[<NodeSize: (us-east-1)="" ...="" bandwidth="None" disk="850" driver="Amazon" ec2="" id="m1.large," instance,="" name="Large" price=".38" ram="7680">, <NodeSize: (us-east-1)="" ...="" bandwidth="None" disk="1690" driver="Amazon" ec2="" extra="" id="c1.xlarge," instance,="" large="" name="High-CPU" price=".76" ram="7680">, <NodeSize: (us-east-1)="" ...="" bandwidth="None" disk="160" driver="Amazon" ec2="" id="m1.small," instance,="" name="Small" price=".095" ram="1740">, <NodeSize: (us-east-1)="" ...="" bandwidth="None" disk="350" driver="Amazon" ec2="" id="c1.medium," instance,="" medium="" name="High-CPU" price=".19" ram="1740">, <NodeSize: (us-east-1)="" ...="" bandwidth="None" disk="1690" driver="Amazon" ec2="" id="m1.xlarge," instance,="" large="" name="Extra" price=".76" ram="15360">]
{'name': 'Large Instance', 'price': '.38', 'ram': 7680, 'driver': <libcloud.drivers.ec2.ec2nodedriver 0xb7f49fec="" at="" object="">, 'bandwidth': None, 'disk': 850, 'id': 'm1.large'}


Same code running against Rackspace:


7
[<NodeSize: ...="" bandwidth="None" disk="10" driver="Rackspace" id="1," name="256" price=".015" ram="256" server,="">, <NodeSize: ...="" bandwidth="None" disk="20" driver="Rackspace" id="2," name="512" price=".030" ram="512" server,="">, <NodeSize: ...="" bandwidth="None" disk="40" driver="Rackspace" id="3," name="1GB" price=".060" ram="1024" server,="">, <NodeSize: ...="" bandwidth="None" disk="80" driver="Rackspace" id="4," name="2GB" price=".120" ram="2048" server,="">, <NodeSize: ...="" bandwidth="None" disk="160" driver="Rackspace" id="5," name="4GB" price=".240" ram="4096" server,="">]
{'name': '256 server', 'price': '.015', 'ram': 256, 'driver': <libcloud.drivers.rackspace.rackspacenodedriver 0x841506c="" at="" object="">, 'bandwidth': None, 'disk': 10, 'id': '1'}


Getting a list of locations available for a provider

As I mentioned before, locations are somewhat ambiguous currently in libcloud.

For example, when you call list_locations on a connection to the EC2 provider (which represents the EC2 US East region), you get information about the region and not about the availability zones (AZs) included in that region:


EC2Driver = get_driver(Provider.EC2)
conn = EC2Driver(EC2_ACCESS_ID, EC2_SECRET_KEY)
print conn.list_locations()
[<NodeLocation: id=0, name=Amazon US N. Virginia, country=US, driver=Amazon EC2 (us-east-1)>]


However, there is a patch sent by Tomaž Muraus to the libcloud mailing list which adds support for EC2 availability zones. For example, the US East region has 4 AZs: us-east-1a, us-east-1b, us-east-1c, us-east-1d. These AZs should be represented by libcloud locations, and indeed the code with the patch applied shows just that:


print conn.list_locations()
[<EC2NodeLocation: id=0, name=Amazon US N. Virginia, country=US, availability_zone=us-east-1a driver=Amazon EC2 (us-east-1)>, <EC2NodeLocation: id=1, name=Amazon US N. Virginia, country=US, availability_zone=us-east-1b driver=Amazon EC2 (us-east-1)>, <EC2NodeLocation: id=2, name=Amazon US N. Virginia, country=US, availability_zone=us-east-1c driver=Amazon EC2 (us-east-1)>, <EC2NodeLocation: id=3, name=Amazon US N. Virginia, country=US, availability_zone=us-east-1d driver=Amazon EC2 (us-east-1)>]


Hopefully the patch will make it soon into the libcloud github repository, and then into the next libcloud release.

(Update 02/24/11The patch did make it in the latest libcloud release which is 0.4.2 at this time)

If you run list_locations on a Rackspace connection, you get back DFW1, even though your instances may actually get deployed at a different data center. Hopefully this too will be fixed soon in libcloud:


Driver = get_driver(Provider.RACKSPACE)
conn = Driver(USER, API_KEY)
print conn.list_locations()
[<NodeLocation: id=0, name=Rackspace DFW1, country=US, driver=Rackspace>]


Launching an instance

The API call for launching an instance with libcloud is create_node. It has 3 required parameters: a name for your new instance, a NodeImage and a NodeSize. You can also specify a NodeLocation (if you don’t, the default location for that provider will be used).

EC2 node creation example

A given provider driver may accept other parameters to the create_node call. For example, EC2 accepts an ex_keyname argument for specifying the EC2 key you want to use when creating the instance.

Note that to create a node, you have to know what image and what size you want to use for that node. Here can come in handy the code snippets I showed above for retrieving images and sizes available for a given provider. You can either retrieve the full list and iterate through the list until you find your desired image and size (either by name or by id), or you can construct NodeImage and NodeSize objects from scratch, based on the desired id.

Example of a NodeImage object for EC2 corresponding to a specific AMI:


image = NodeImage(id="ami-014da868", name="", driver="")


Example of a NodeSize object for EC2 corresponding to an m1.small instance size:


size = NodeSize(id="m1.small", name="", ram=None, disk=None, bandwidth=None, price=None, driver="")


Note that in both examples the only parameter that need to be set is the id, but all the other parameters need to be present in the call, even if they are set to None or the empty string.

In the case of EC2, for the instance to be actually usable via ssh, you also need to pass the ex_keyname parameter and set it to a keypair name that exists in your EC2 account for that region. Libcloud provides a way to create or import a keypair programmatically. Here is a code snippet that creates a keypair via the ex_create_keypair call (specific to the libcloud EC2 driver), then saves the private key in a file in /root/.ssh on the machine running the code:


keyname = sys.argv[1]
resp = conn.ex_create_keypair(name=keyname)
key_material = resp.get('keyMaterial')
if not key_material:
sys.exit(1)
private_key = '/root/.ssh/%s.pem' % keyname
f = open(private_key, 'w')
f.write(key_material + '\n')
f.close()
os.chmod(private_key, 0600)


You can also pass the name of an EC2 security group to create_node via the ex_securitygroup parameter. Libcloud also allows you to create security groups programmatically by means of the ex_create_security_group method specific to the libcloud EC2 driver.

Now, armed with the NodeImage and NodeSize objects constructed above, as well as the keypair name, we can launch an instance in EC2:


node = conn.create_node(name='test1', image=image, size=size, ex_keyname=keyname)


Note that we didn’t specify any location, so we have no control over the availability zone where the instance will be created. With Tomaž’s patch we can actually get a location corresponding to our desired availability zone, then launch the instance in that zone. Here is an example for us-east-1b:


locations = conn.list_locations()
for location in locations:
if location.availability_zone.name == 'us-east-1b':
break
node = conn.create_node(name='tst', image=image, size=size, location=location, ex_keyname=keyname)


Once the node is created, you can call the list_nodes method on the connection object and inspect the current status of the node, along with other information about that node. In EC2, a new instance is initially shown with a status of ‘pending’. Once the status changes to ‘running’, you can ssh into that instance using the private key created above.

Printing node.__dict__ for a newly created instance shows it with ‘pending’ status:


{'name': 'i-f692ae9b', 'extra': {'status': 'pending', 'productcode': [], 'groups': None, 'instanceId': 'i-f692ae9b', 'dns_name': '', 'launchdatetime': '2010-12-14T20:25:22.000Z', 'imageId': 'ami-014da868', 'kernelid': None, 'keyname': 'k1', 'availability': 'us-east-1d', 'launchindex': '0', 'ramdiskid': None, 'private_dns': '', 'instancetype': 'm1.small'}, 'driver': <libcloud.drivers.ec2.ec2nodedriver 0x9e088ec="" at="" object="">, 'public_ip': [''], 'state': 3, 'private_ip': [''], 'id': 'i-f692ae9b', 'uuid': '76fcd974aab6f50092e5a637d6edbac140d7542c'}


Printing node.__dict__ a few minutes after the instance was launched shows the instance with ‘running’ status:


{'name': 'i-f692ae9b', 'extra': {'status': 'running', 'productcode': [], 'groups': ['default'], 'instanceId': 'i-f692ae9b', 'dns_name': 'ec2-184-72-92-114.compute-1.amazonaws.com', 'launchdatetime': '2010-12-14T20:25:22.000Z', 'imageId': 'ami-014da868', 'kernelid': None, 'keyname': 'k1', 'availability': 'us-east-1d', 'launchindex': '0', 'ramdiskid': None, 'private_dns': 'domU-12-31-39-04-65-11.compute-1.internal', 'instancetype': 'm1.small'}, 'driver': <libcloud.drivers.ec2.ec2nodedriver 0x93f42cc="" at="" object="">, 'public_ip': ['ec2-184-72-92-114.compute-1.amazonaws.com'], 'state': 0, 'private_ip': ['domU-12-31-39-04-65-11.compute-1.internal'], 'id': 'i-f692ae9b', 'uuid': '76fcd974aab6f50092e5a637d6edbac140d7542c'}


Note also that the ‘extra’ member variable of the node object shows a wealth of information specific to EC2 -- things such as security group, AMI id, kernel id, availability zone, private and public DNS names, etc. Another interesting thing to note is that the name member variable of the node object is now set to the EC2 instance id, thus guaranteeing uniqueness of names across EC2 node objects.

At this point (assuming the machine where you run the libcloud code is allowed ssh access into the default EC2 security group) you should be able to ssh into the newly created instance using the private key corresponding to the keypair you used to create the instance. In my case, I used the k1.pem private file created via ex_create_keypair and I ssh-ed into the private IP address of the new instance, because I was already on an EC2 instance in the same availability zone:

# ssh -i ~/.ssh/k1.pem domU-12-31-39-04-65-11.compute-1.internal


Rackspace node creation example

Here is another example of calling node_create, this time using Rackspace as the provider. Before I ran this code, I already called list_images and list_sizes on the Rackspace connection object, so I know that I want the NodeImage with id 71 (which happens to be Fedora 14) and the NodeSize with id 1 (the smallest one). The code snippet below will create the node using the image and the size I specify, with a name that I also specify (this name needs to be different for each call of create_node):


Driver = get_driver(Provider.RACKSPACE)
conn = Driver(USER, API_KEY)
images = conn.list_images()
for image in images:
if image.id == '71':
break
sizes = conn.list_sizes()
for size in sizes:
if size.id == '1':
break
node = conn.create_node(name='testrackspace', image=image, size=size)
print node.__dict__


The code prints out:


{'name': 'testrackspace', 'extra': {'metadata': {}, 'password': 'testrackspaceO1jk6O5jV', 'flavorId': '1', 'hostId': '9bff080afbd3bec3ca140048311049f9', 'imageId': '71'}, 'driver': <libcloud.drivers.rackspace.rackspacenodedriver 0x877c3ec="" at="" object="">, 'public_ip': ['184.106.187.226'], 'state': 3, 'private_ip': ['10.180.67.242'], 'id': '497741', 'uuid': '1fbf7c3fde339af9fa901af6bf0b73d4d10472bb'}


Note that the name variable of the node object was set to the name we specified in the create_node call. You don’t log in with a key (at least initially) to a Rackspace node, but instead you’re given a password you can use to log in as root to the public IP that is also returned in the node information:

ssh root@184.106.187.226root@184.106.187.226's password:[root@testrackspace ~]#


Rebooting and destroying instances

Once you have a list of nodes in a given provider, it’s easy to iterate through the list and choose a given node based on its unique name -- which as we’ve seen is the instance id for EC2 and the hostname for Rackspace. Once you identify a node, you can call destroy_node or reboot_node on the connection object to terminate or reboot that node.

Here is a code snippet that performs a destroy_node operation for an EC2 instance with a specific instance id:


EC2Driver = get_driver(Provider.EC2)
conn = EC2Driver(EC2_ACCESS_ID, EC2_SECRET_KEY)
nodes = conn.list_nodes()
for node in nodes:
if node.name == 'i-66724d0b':
conn.destroy_node(node)


Here is another code snippet that performs a reboot_node operation for a Rackspace node with a specific hostname:


Driver = get_driver(Provider.RACKSPACE)
conn = Driver(USER, API_KEY)
nodes = conn.list_nodes()
for node in nodes:
if node.name == 'testrackspace':
conn.reboot_node(node)


The Overmind project

I would be remiss if I didn’t mention a new but very promising project started by Miquel Torres: Overmind. The goal of Overmind is to be a complete server provisioning and configuration management system. For the server provisioning portion, Overmind uses libcloud, while also offering a Django-based Web interface for managing providers and nodes. EC2 and Rackspace are supported currently, but it should be easy to add new providers. If you are interested in trying out Overmind and contributing code or tests, please send a message to the overmind-dev mailing list. Next versions of Overmind aim to add configuration management capabilities using Opscode Chef.

Further reading

Friday, December 10, 2010

A Fabric script for striping EBS volumes

Here's a short Fabric script which might be useful to people who need to stripe EBS volumes in Amazon EC2. Striping is recommended if you want to improve the I/O of your EBS-based volumes. However, striping won't help if one of the member EBS volumes goes AWOL or suffers performance issues. In any case, here's the Fabric script:

import commands
from fabric.api import *

# Globals

env.project='EBSSTRIPING'
env.user = 'myuser'

DEVICES = [
    "/dev/sdd",
    "/dev/sde",
    "/dev/sdf",
    "/dev/sdg",
]

VOL_SIZE = 400 # GB

# Tasks

def install():
    install_packages()
    create_raid0()
    create_lvm()
    mkfs_mount_lvm()

def install_packages():
    run('DEBIAN_FRONTEND=noninteractive apt-get -y install mdadm')
    run('apt-get -y install lvm2')
    run('modprobe dm-mod')
    
def create_raid0():
    cmd = 'mdadm --create /dev/md0 --level=0 --chunk=256 --raid-devices=4 '
    for device in DEVICES:
        cmd += '%s ' % device
    run(cmd)
    run('blockdev --setra 65536 /dev/md0')

def create_lvm():
    run('pvcreate /dev/md0')
    run('vgcreate vgm0 /dev/md0')
    run('lvcreate --name lvm0 --size %dG vgm0' % VOL_SIZE)

def mkfs_mount_lvm():
    run('mkfs.xfs /dev/vgm0/lvm0')
    run('mkdir -p /mnt/lvm0')
    run('echo "/dev/vgm0/lvm0 /mnt/lvm0 xfs defaults 0 0" >> /etc/fstab')
    run('mount /mnt/lvm0')

A few things to note:

  • I assume that you already created and attached 4 EBS volumes to your instance with device names /dev/sdd through /dev/sdg; if your device names or volume count are different, modify the DEVICES list appropriately
  • The size of your target RAID0 volume is set in the VOL_SIZE variable
  • the helper functions are pretty self-explanatory: 
    1. we use mdadm to create a RAID0 device called /dev/md0; we also set the block size to 64 KB via the blockdev call
    2. we create a physical LVM volume on /dev/md0
    3. we create a volume group called vgm0 on /dev/md0
    4. we create a logical LVM volume called lvm0 of size VOL_SIZE, inside the vgm0 group
    5. we format the logical volume as XFS, then we mount it and also modify /etc/fstab
That's it. Hopefully it will be useful to somebody out there.

Tuesday, November 30, 2010

Working with Chef attributes

It took me a while to really get how to use Chef attributes. It's fairly easy to understand what they are and where they are referenced in recipes, but it's not so clear from the documentation how and where to override them. Here's a quick note to clarify this.

A Chef attribute can be seen as a variable that:

1) gets initialized to a default value in cookbooks/mycookbook/attributes/default.rb

Examples:

default[:mycookbook][:swapfilesize] = '10485760'
default[:mycookbook][:tornado_version] = '1.1'
default[:mycookbook][:haproxy_version] = '1.4.8'
default[:mycookbook][:nginx_version] = '0.8.20'

2) gets used in cookbook recipes such as cookbooks.mycookbook/recipes/default.rb or any other myrecipefile.rb in the recipes directory; the syntax for using the attribute's value is of the form #{node[:mycookbook][:attribute_name]}

Example of using the haproxy_version attribute in a recipe called haproxy.rb:

# install haproxy from source
haproxy = "haproxy-#{node[:mycookbook][:haproxy_version]}"
haproxy_pkg = "#{haproxy}.tar.gz"

downloads = [
    "#{haproxy_pkg}",
]

downloads.each do |file|
    remote_file "/tmp/#{file}" do
        source "http://myserver.com/download/haproxy/#{file}"
    end
end

....etc.

Example of using the swapfilesize attribute in the default recipe default.rb:

# create swap file if it doesn't exist
SWAPFILE=/data/swapfile1

if [ -e "$SWAPFILE" ]
  then
   exit 0
fi
dd if=/dev/zero of=$SWAPFILE bs=1024 count=#{node[:mycookbook][:swapfilesize]}
mkswap $SWAPFILE
swapon $SWAPFILE
echo "$SWAPFILE swap swap defaults 0 0" >> /etc/fstab


3) can be overridden at either the role or the node level (and some other more obscure levels that I haven't used in practice)

I prefer to override attributes at the role level, because I want those overridden values to apply to all nodes pertaining to that role. 

For example, I have a role called appserver, which is defined in a file called appserver.rb in the roles directory:

# cat appserver.rb 
name "appserver"
description "Installs required packages and applications for an app server"
run_list "recipe[mycookbook::appserver]", "recipe[mycookbook::haproxy]", "recipe[memcached]"
override_attributes "mycookbook" => { "swapfilesize" => "4194304" }, "memcached" => { "memory" => "4096" }

Here I override the default swapfilesize value (an attribute from the mycookbook cookbook) of 10 GB and set it to 4 GB. I also override the default memcached memory value (an attribute from the Opscode memcached cookbook) of 128 MB and set it
to 4 GB.

If however you want to override some attributes at the node level, you could do this in the chef.json file on the node if you wanted for example to set the swap size to 2 GB:

"run_list": [ "role[base]", "role[appserver]" ]
"mycookbook": { "swapfilesize": "2097152"}

Anothe question is when should you use Chef attributes? My own observation is that wherever I use hardcoded values in my recipes, it's almost always better to use an attribute instead, and set the default value of the attribute to that hardcoded value, which can be then overridden as needed.

Tuesday, November 16, 2010

How to whip your infrastructure into shape

It's easy, just follow these steps:

Step 0. If you're fortunate enough to participate in the design of your infrastructure (as opposed to being thrown at the deep end and having to maintain some 'legacy' one), then try to aim for horizontal scalability. It's easier to scale out than to scale up, and failures in this mode will hopefully impact a smaller percentage of your users.

Step 1. Configure a good monitoring and alerting system

This is the single most important thing you need to do for your infrastructure. It's also a great way to learn a new infrastructure that you need to maintain.

I talked about different types of monitoring in another blog post. My preferred approach is to have 2 monitoring systems in place:
  • an internal monitoring system which I use to check the health of individual servers/devices
  • an external monitoring system used to check the behavior of the application/web site as a regular user would.

My preferred internal monitoring/alerting system is Nagios, but tools like Zabbix, OpenNMS, Zenoss, Monit etc. would definitely also do the job. I like Nagios because there is a wide variety of plugins already available (such as the extremely useful check_mysql_health plugin) and also because it's very easy to write custom plugin for your specific application needs. It's also relatively easy to generate Nagios configuration files automatically.

For external monitoring I use a combination of Pingdom and Akamai alerts. Pingdom runs checks against certain URLs within our application, whereas Akamai alerts us whenever the percentage of HTTP error codes returned by our application is greater than a certain threshold.

I'll talk more about correlating internal and external alerts below.

Step 2. Configure a good resource graphing system

This is the second most important thing you need to do for your infrastructure. It gives you visibility into how your system resources are used. If you don't have this visibility, it's very hard to do proper capacity planning. It's also hard to correlate monitoring alerts with resource limits you might have reached.

I use both Munin and Ganglia for resource graphing. I like the graphs that Munin produces and also some of the plugins that are available (such as the munin-mysql plugin), and I also like Ganglia's nice graph aggregation feature, which allows me to watch the same system resource across a cluster of nodes. Munin has this feature too, but Ganglia was designed from the get-go to work on clusters of machines.

Step 3. Dashboards, dashboards, dashboards

Everybody knows that whoever has the most dashboards wins. I am talking here about application-specific metrics that you want to track over time. I gave an example before of a dashboard I built for visualizing the outgoing email count through our system.

It's very easy to build such a dashboard with the Google Visualization API, so there's really no excuse for not having charts for critical metrics of your infrastructure. We use queuing a lot internally at Evite, so we have dashboards for tracking various queue sizes. We also track application errors from nginx logs and chart them in various ways: by server, by error code, by URL, aggregated, etc.

Dashboards offered by external monitoring tools such as Pingdom/Keynote/Gomez/Akamai are also very useful. They typically chart uptime and response time for various pages, and edge/origin HTTP traffic in the case of Akamai.

Step 4. Correlate errors with resource state and capacity

The combination of internal and external monitoring, resource charting and application dashboards is very powerful. As a rule, whenever you have an external alert firing off, you should have one or more internal ones firing off too. If you don't, then you don't have sufficient internal alerts, so you need to work on that aspect of your monitoring.

Once you do have external and internal alerts firing off in unison, you will be able to correlate external issues (such as increased percentages of HTTP error codes, or timeouts in certain application URLs) with server capacity issues/bottlenecks within your infrastructure. Of course, the fact that you are charting resources over time, and that you have a baseline to go from, will help you quickly identify outliers such as spikes in CPU usage or drops in Akamai traffic.

A typical work day for me starts with me opening a few tabs in my browser: the Nagios overview page, the Munin overview, the Ganglia overview, the Akamai HTTP content delivery dashboard, and various application-specific dashboards.

Let's say I get an alert from Akamai that the percentage of HTTP 500 error codes is over 1%. I start by checking the resource graphs for our database servers. I look at in-depth MySQL metrics in Munin, and at CPU metrics (especially CPU I/O wait time) in Ganglia. If nothing is out of the ordinary, I look at our various application services (our application consists of a multitude of RESTful Web services). The nginx log dashboard may show increased HTTP 500 errors from a particular server, or it may show an increase in such errors across the board. This may point to insufficient capacity at our services layer. Time to deploy more services on servers with enough CPU/RAM capacity. I know which servers those are, because I keep tabs on them with Munin and Ganglia.

As another example, I know that if the CPU I/O wait on my database servers approaches 30%, the servers will start huffing and puffing, and I'll see an increased number of slow queries. In this case, it's time to either identify queries to be optimized, or reduce the number of queries to the database -- or if everything else fails, time to add more database servers. (BTW, if you haven't yet read @allspaw's book "The Art of Capacity Planning", add reading it as a task for Step 0)

My point is that all these alerts and metric graphs are interconnected, and without looking at all of them, you're flying blind.

Step 5. Expect failures and recover quickly and gracefully

It's not a question whether failures will happen, it's WHEN they will happen. When they do happen, you need to be prepared. Hopefully you designed your infrastructure in a way that allows you to bounce back quickly from failures. If a database server goes down, hopefully you have a slave that you can quickly promote to a master, or even better you have another passive master ready to become the active server. Even better, maybe you have a fancy self-healing distributed database -- kudos to you then ;-)

One thing that you can do here is to have various knobs that turn on and off certain features or pieces of functionality within your application (again, John Allspaw has some blog posts and presentations on that from his days at Flickr and his current role at Etsy). These knobs allow you to survive an application server outage, or even (God forbid) a database outage, while still being able to present *something* to your end-users.

To quickly bounce back from a server failure, I recommend you use automated deployment and configuration management tools such as Chef, Puppet, Fabric, etc. (see some posts of mine on this topic). I personally use a combination of Chef (to bootstrap a new machine and do things as file system layout, pre-requisite installation etc) and Fabric (to actually deploy the application code).


Update #1:

Comment on Twitter:

@ericholscher:

"@griggheo Good stuff. Any thoughts on figuring out symptom's from causes? eg. load balancer is having issues which causes db load to drop?"

Good question, and something similar actually has happened to us. To me, it's a matter of knowing your baseline graphs. In our case, whenever I see an Akamai traffic drop, it's usually correlated to an increase in the percentage of HTTP 500 errors returned by our Web services. If I also see DB traffic dropping, then I know the bottleneck is at the application services layer. If the DB traffic is increasing, then the bottleneck is most likely the DB. Depending on the bottleneck, we need to add capacity at that layer, or to optimize code or DB queries at the respective layer.

Main accomplishment of this post

I'm most proud of the fact that I haven't used the following words in the post above: 'devops', 'cloud', 'noSQL' and 'agile'.

Thursday, October 28, 2010

MySQL load balancing with HAProxy

In an earlier blog post I was advising people to use HAProxy 1.4 and above if they need MySQL load balancing with health checks. It turns out that I didn't have much luck with that solution either. HAProxy shines when it load balances HTTP traffic, and its health checks are really meant to be run over HTTP and not plain TCP. So the solution I found was to have a small HTTP Web service (which I wrote using tornado) listening on a configurable port on each  MySQL node.

For the health check, the Web service connects via MySQLdb to the MySQL instance running on a given port and issues a 'show databases' command. For more in-depth checking you can obviously run fancier SQL statements.

The code for my small tornado server is here. The default port it listens on is 31337.

Now on the HAProxy side I have a "listen" section for each collection of MySQL nodes that I want to load balance. Example:
listen mysql-m0 0.0.0.0:33306
  mode tcp
  option httpchk GET /mysqlchk/?port=3306
  balance roundrobin
  server db101 10.10.10.1:3306 check port 31337 inter 5000 rise 3 fall 3
  server db201 10.10.10.2:3306 check port 31337 inter 5000 rise 3 fall 3 backup
In this case, HAProxy listens on port 33306 and load balances MySQL traffic between db101 and db201, with db101 being the primary node and db201 being the backup node (which means that traffic only goes to db101 unless it's considered down by the health check, in which case traffic is directed to db201). This scenario is especially useful when db101 and db201 are in a master-master replication setup, and you want traffic to hit only 1 of them at any given time. Note also that I could have had HAProxy listen on port 3306, but I preferred to have it listen and be contacted by the application on port 33306, in case I also wanted to run a MySQL server in port 3306 on the same server as HAProxy.

I specify how to call the HTTP check handler via "option httpchk GET /mysqlchk/?port=3306". I specify the port the handler listens on via the "port" option in the "server" line. In my case the port is 31337. So HAProxy will do a GET against http://10.10.10.1:31337/mysqlchk/?port=3306. If the result is an HTTP error code, the health check will be considered failed.

The other options "inter 5000 rise 3 fall 3" mean that the health check is issued by HAProxy every 5,000 ms, and that the health check needs to succeed 3 times ("rise 3") in order for the node to be considered up, and it needs to fail 3 times ("fall 3") in order for the node to be considered down.

I hasten to add that the master-master load balancing has its disadvantages. It did save my butt one Sunday morning when db101 went down hard (after all, it was an EC2 instance), and traffic was directed by HAProxy to db201 in a totally transparent fashion to the application.

But....I have also seen the situation where db201, as a slave to db101, lagged in its replication, and so when db101 was considered down and traffic was sent to db201, the state of the data was stale from an application point of view. I consider this disadvantage to weigh more than the automatic failover advantage, so I actually ended up taking db201 out of HAProxy. If db101 ever goes down hard again, I'll just manually point HAProxy to db201, after making sure the state of the data on db201 is what I expect.

So all this being said, I recommend the automated failover scenario only when load balance against a read-only farm of MySQL servers, which are all probably slaves of some master. In this case, although reads can also get out of sync, at least you won't attempt to do creates/updates/deletes against stale data.

The sad truth is that there is no good way of doing automated load balancing AND failover with MySQL without resorting to things such as DRBD which are not cloud-friendly. I am aware of Yves Trudeau's blog posts on "High availability for MySQL on Amazon EC2" but the setup he describes strikes me as experimental and I wouldn't trust it in a large-scale production setup.

In any case, I hope somebody will find the tornado handler I wrote useful for their own MySQL health checks, or actually any TCP-based health check they need to do within HAProxy.

Thursday, October 14, 2010

Introducing project "Overmind"

Overmind is the brainchild of Miquel Torres. In its current version, released today, Overmind is what is sometimes called a 'controller fabric' for managing cloud instances, based on libcloud. However, Miquel's Roadmap for the project is very ambitious, and includes things like automated configuration management and monitoring for the instances launched and managed via Overmind.

A little bit of history: Miquel contacted me via email in late July because he read my blog post on "Automated deployment systems: push vs. pull" and he was interested in collaborating on a queue-based deployment/config management system. The first step in such a system is to actually deploy the instances you need configured. Hence the need for something like Overmind.

I'm sure you're asking yourself -- why do these guys wanted to roll their own system? Why not use something like OpenStack? Note in late July OpenStack had only just been announced, and to this day (mid-October 2010) they have yet to release their controller fabric code. In the mean time, we have a pretty functional version of a deployment tool in Overmind, supporting Amazon EC2 and Rackspace, with a Django Web interface, and also with a REST API interface.

I am aware there are many other choices out there in terms of managing and deploying cloud instances -- Cloudkick, RightScale, Scalarium ...and the list goes on. The problem is that none of these is Open Source. They do have great ideas though that we can steal ;-)

I am also aware of Ruby-based tools such as Marionette Collective and its close integration with Puppet (which is now even closer since it has been acquired by Puppet Labs). The problem is that it's Ruby and not Python ;-)

In short, what Overmind brings to the table today is a Python-based, Django-based, libcloud-based tool for deploying (and destroying, but be careful out there) cloud instances. For the next release, Miquel and I are planning to add some configuration management capabilities. We're looking at kokki as a very interesting Python-based alternative to chef, although we're planning on supporting chef-solo too.

If you're interested in contributing to the project, please do! Miquel is an amazingly talented, focused and relentless developer, but he can definitely use more help (my contributions have been minimal in terms of actual code; I mostly tested Miquel's code and did some design and documentation work, especially in the REST API area).

Here are some pointers to Overmind-related resources:

Modifying EC2 security groups via AWS Lambda functions

One task that comes up again and again is adding, removing or updating source CIDR blocks in various security groups in an EC2 infrastructur...